Model
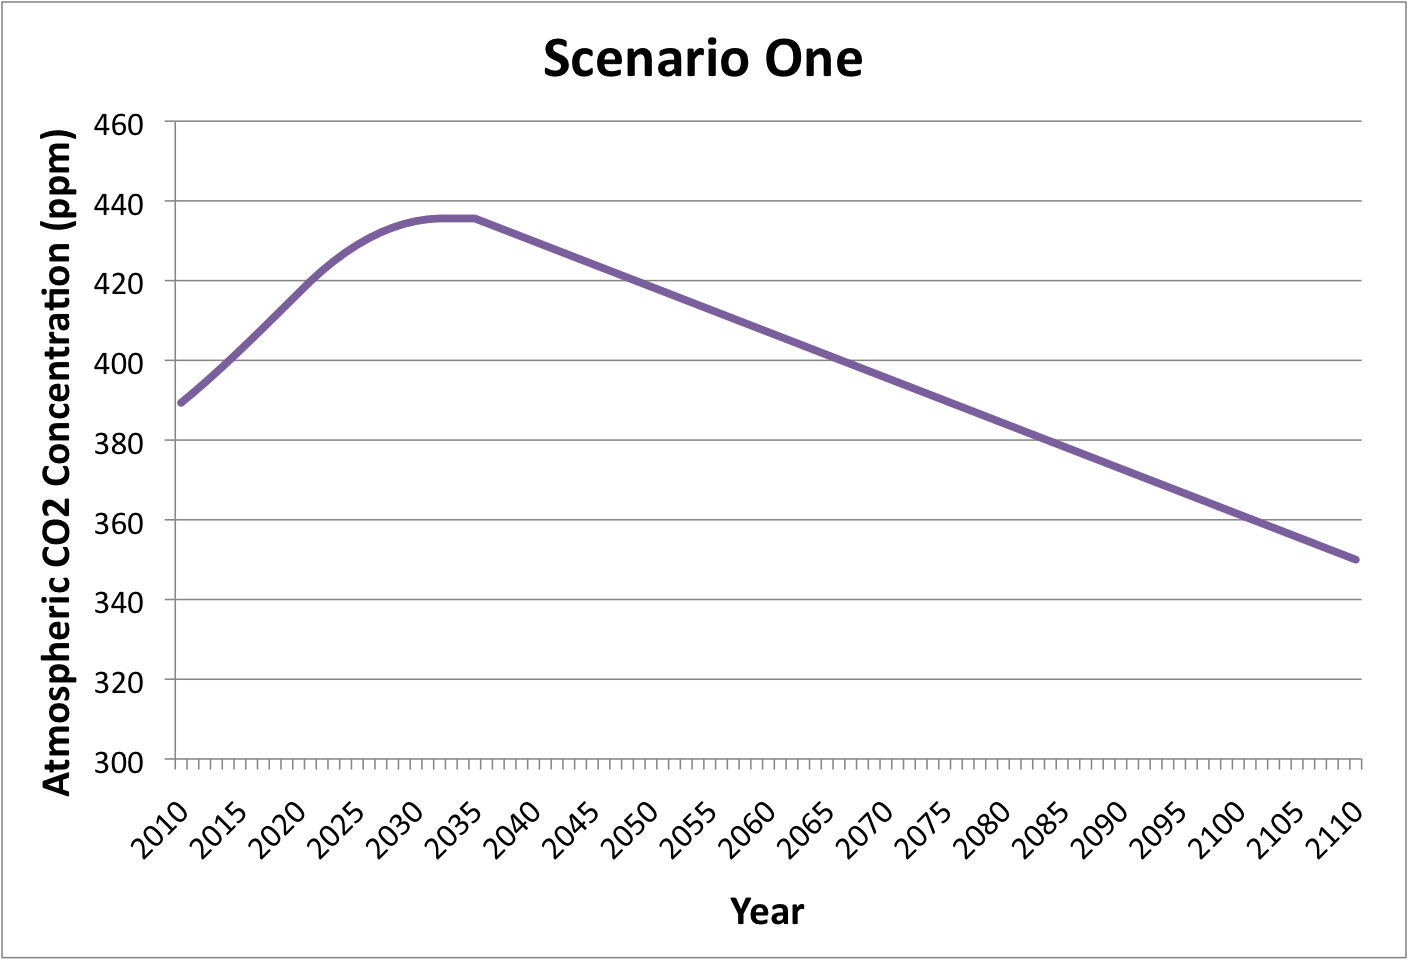
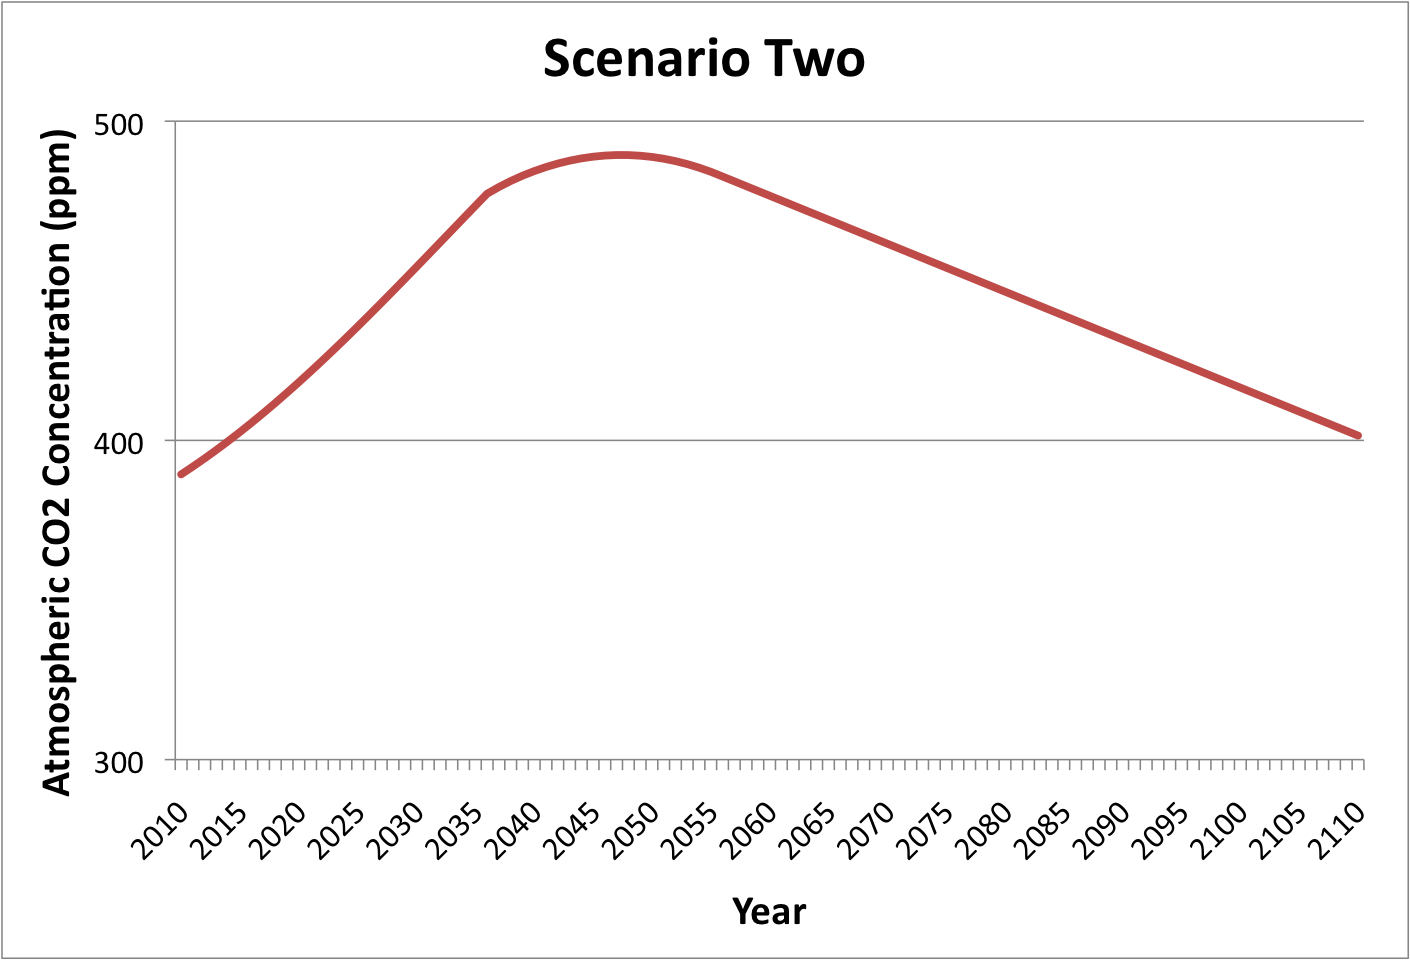
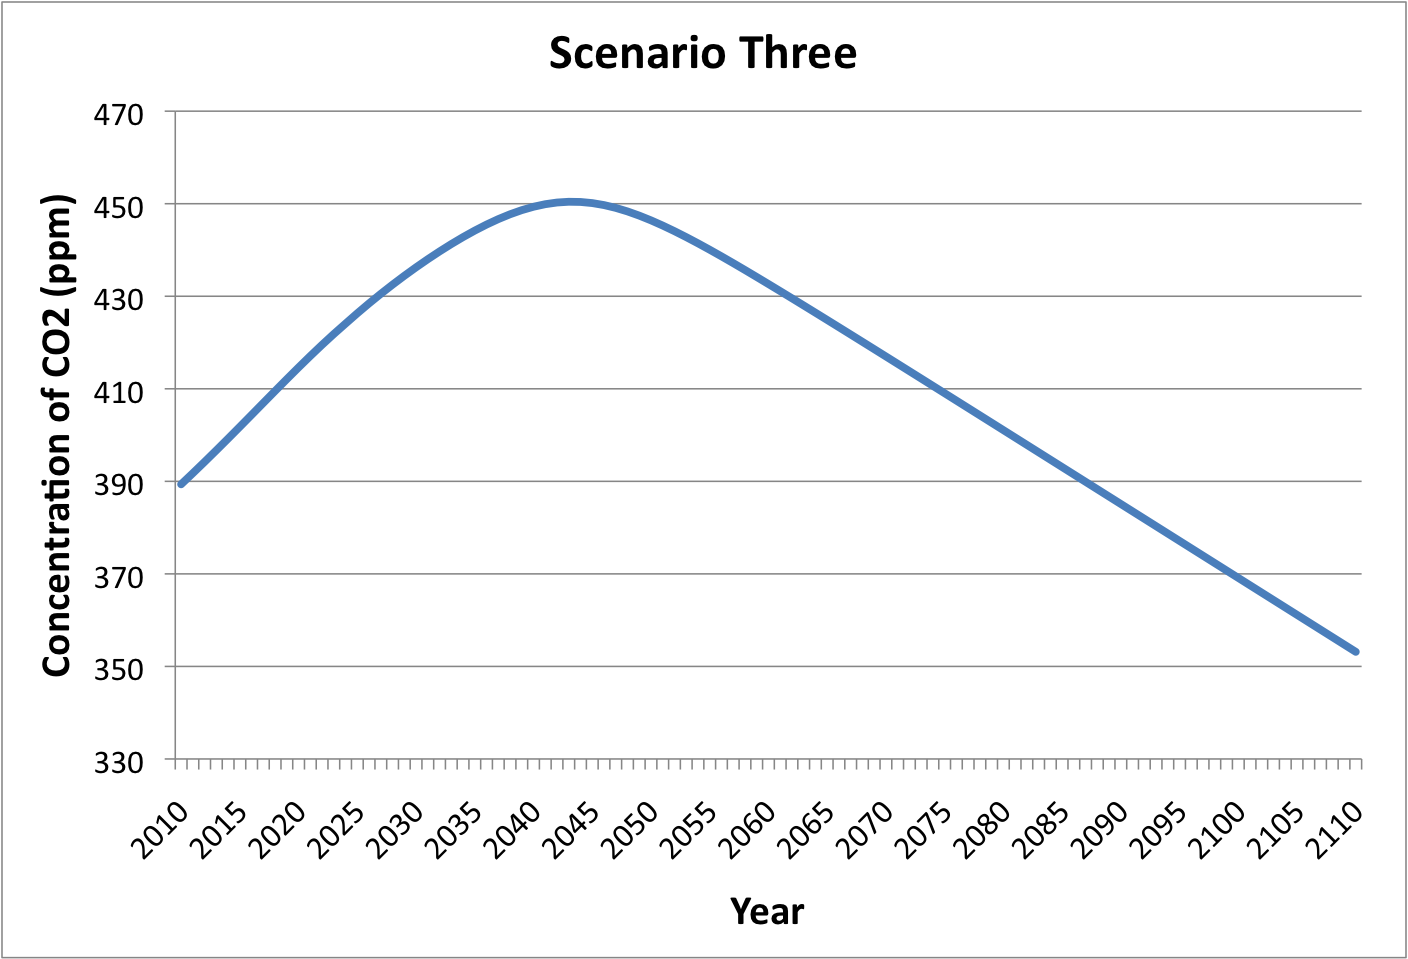
In order to fulfill our vision statement, we modeled three different scenarios that had the prospect of being implemented. The first scenario calls for stabilization of global carbon emissions by 2020, and the elimination of carbon dioxide emissions by 2035. The second scenario reflects a stabilization of emissions by 2035 with the elimination of carbon dioxide emissions by 2060. The final scenario stabilizes emissions by 2025 and eliminates carbon dioxide emissions by 2044.
While we see the potential for the implementation of any of the scenarios, as a class we decided to endorse the third plan that calls for stabilization of emissions in 15 years and elimination of emissions in 34 years. While the first scenario minimizes the change in atmospheric carbon dioxide concentrations, the rigorous requirements to achieve stabilization and elimination of carbon dioxide emissions detracted from the feasibility of this scenario. The sudden and rapid growth of sequestration infrastructure required to eliminate emissions in 25 years would put too much economic strain upon the global economy. Conversely, the second scenario’s extended time before stabilization and elimination of emissions promoted it’s feasibility, but at the sacrifice of rising levels of carbon dioxide in the atmosphere. The third scenario achieves a balance between feasibility and atmospheric carbon dioxide levels, making it the optimum plan.
Method of Developing the Models:
We used the IPCC’s A2 integrated assessment model to predict yearly growth in carbon emissions, assuming business as usual (International Panel on Climate Change Data Distribution Center). From this, we detracted the annual amount of carbon absorption by natural sinks, assuming a 1.5% yearly decrease in sink capacity (Bahnoo). Presently, the net emissions, taking into account the natural effects of sinks, of carbon are around 5 Gt, or conversely, 18 Gt of CO2 (Houghton).


From this point, we then calculated annual emissions following the implementation of our three scenarios. Using these figures, we determined how much carbon dioxide would be captured and sequestered. The three means of carbon capture we incorporated into our model were forestry, point source capture, and air capture.
· Forestry: forestry, including agroforestry, anti-deforestation, and reforestation, has the capacity to capture nearly 7 Gt of CO2 annually from the atmosphere (Dixon and Kindermann). In our model, we allowed a 30 year time period for forestry to reach this capacity of capture and sequestration, allotting time for policy enactments and tree growth. We used a sigmoid function to model the growth of the gradual expansion of forestry capture and sequestration. The sigmoid function simulates a growth that starts of gradually, enters a period of rapid growth, and finally tappers off.
· Point Source: Point source carbon capture can only be implemented to eliminate 50% of CO2 emissions (Mahmoudkhani). Thus, point source capture is responsible for removing half of the global emissions necessary to reach a zero net emissions state. We used a sigmoid function to calculate growth in point source technology starting in 2025. Point source covers the initial capture of emissions up until the amount of emissions being captured exceeds 50% of the amount of emissions being produced. The sequestration potential of forestry as well as the absorption of CO2 by natural sinks in able to account for eliminating the remaining emissions. Point source capture, however, is only 90% effective, releasing 10% of would be captured emissions into the atmosphere.
· Air Capture: Air capture is necessary to remove CO2 already in the atmosphere in order to reach our ultimate goal of 350 ppm. Our model started implementation of air capture in 2030 and used a sigmoid function to model the growth in air capture technology.
Scenario One: Stabilize emissions by 2020; Eliminate emissions by 2035
Scenario Two: Stabilize emissions by 2035; Eliminate emissions by 2060
Scenario Three: Stabilize emissions by 2025; Eliminate emissions by 2044
Comparison of the Three Scenarios:
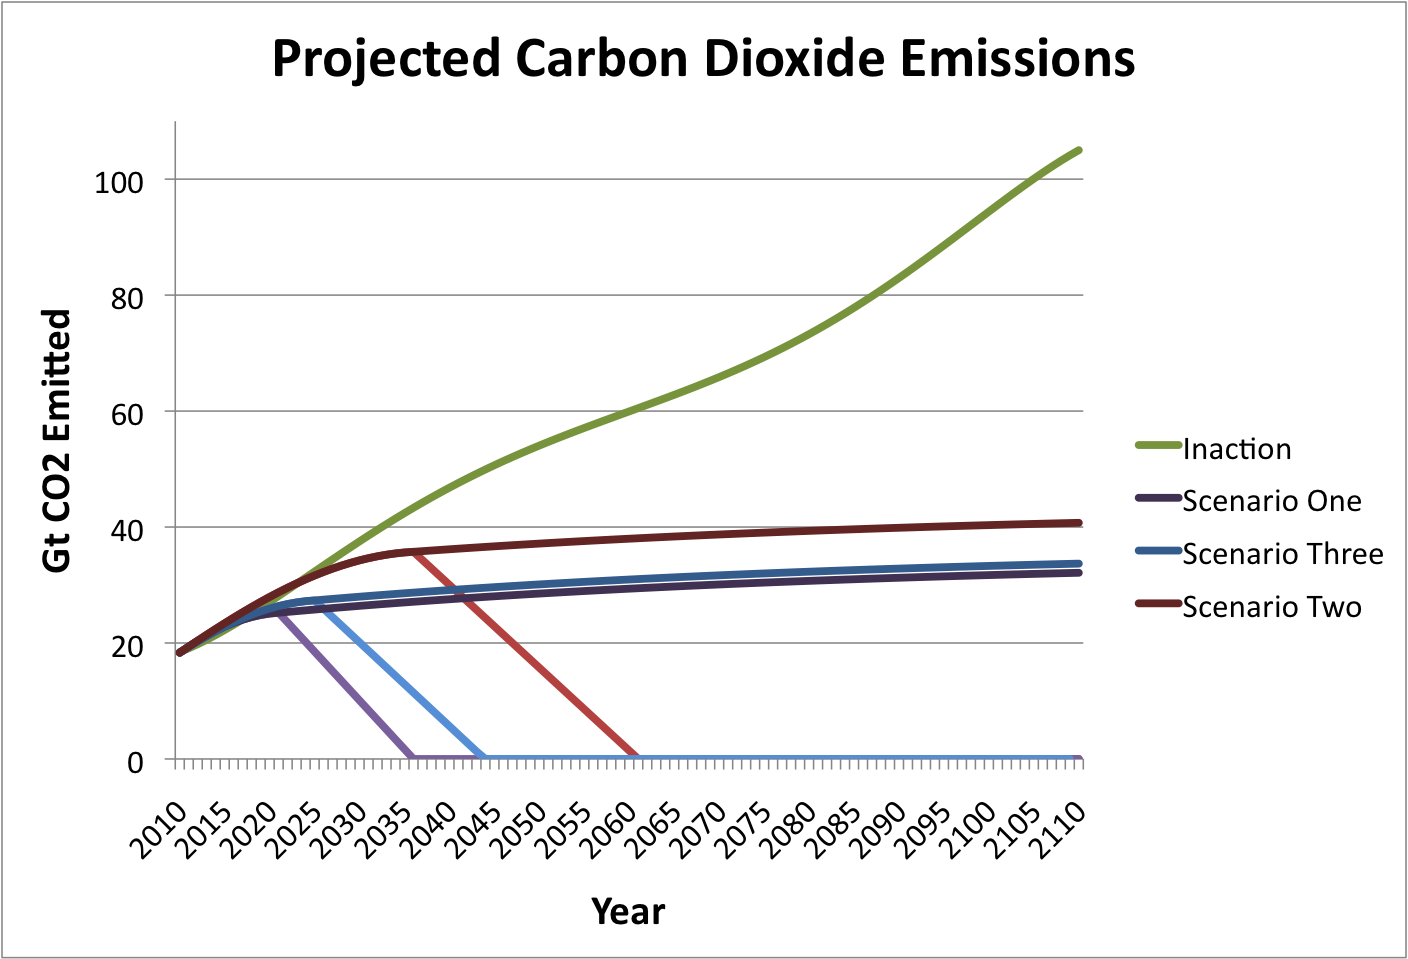
The solid green line represents the projected emissions assuming the continuation of current trends and a plan of inaction. The scenarios one, two, and three are illustrated by purple, red, and blue lines, respectively. The area of the graph between the green line and the upper, darker line of the scenarios illustrates the amount of emission reductions, policy, improved efficiency and alternative energy technology necessary to continue with our projected growth rate while achieving stabilization of CO2 emissions. The area of the graph between the darker and lighter line of the scenario reflects the amount of CO2 that would need to be captured and sequestered.
Deeper Analysis into the Breakdown of Scenario Three:
Since we decided to endorse the third scenario, we used this model to look deeper into the practical application of our solution.

The above graph illustrates how each portion of our plan accounts for avoiding or removing would be emissions assuming business as usual growth. These portions of the graph are slightly transparent to illustrate the emissions avoided by sequestering CO2.
· Alternative Energy is used to help stabilize emissions, by allowing for continued energy growth without emissions growth. Business as usual growth in emissions, however, is both in the form of dispersed sources (cars, pastures, etc.) and point sources (power plants, etc.). All our alternative energies are electricity generation, and so cannot displace all emissions growth. At present, approximately half of all CO2 emissions come from point sources (Mahmoudkhani), not all of which are power generation. We accounted for this in the beginning of our plan by assuming 40% of the reductions using alternative energies, and 60% using other emission reductions. With strict climate policy, the proportion of emissions is expected to shift significantly towards electrical sources (EPRI). Thus, as an estimate, we assumed that, by the end of the century, 75% of increase in emissions will be accounted for by alternatives, and 25% by other emission reductions, and that there is a linear change in proportions. Alternative energies, with the exception of wind, begin implementation in 2025. Overall, alternatives avoid 2124 Gt of CO2.
· Wind energy begins implementation immediately. We assumed growth in coal power plants would account for half of the growth in emissions. Of this growth, our plan allows for 20% to be growth in coal power, while the remaining growth is achieved through wind power and natural gas. As renewable energies come into play, however, the growth of natural gas, wind and coal use taper off. Wind is used to cover 32% of would be coal growth and emissions from coal, avoiding 153 Gt CO2.
· Natural gas starts immediately and accounts for 48% of the growth that would be from coal power plants. Natural gas, however, is more effective than coal. Comparable amounts of energy produced using natural gas as opposed to coal release about half the emissions that would be released if coal were used. Thus, while natural gas still releases CO2, using natural gas in place of coal still accounts for an avoidance of 204 Gt of CO2 emissions.
· Policy, improved efficiency, and emission reductions are used to cover the amount of CO2 emissions growth that aren’t accounted for by alternative energy, wind energy, or natural gas. Policy avoids 1455 Gt of CO2 emissions.
· Forestry begins immediately, but allowing for a 30 year time period to fully develop to its maximum capacity of annually sequestering about 7 Gt CO2. Over the course of our plan, forestry will remove over 600 Gt of CO2 from the atmosphere.
· Point source capture begins in 2025 and is responsible for eliminating half of our annual emissions, around 15 Gt of CO2 per year once full implementation has been reached. The technology, however, is only 90% effective, and thus would release 10% of what would be captured emissions into the atmosphere. Taking this into account, point source would capture nearly 1020 Gt CO2 over the 100 year time frame of our solution.
· Air capture is responsible capturing the additional atmospheric CO2 necessary to reach our 350 ppm goal. By 2110, this would require air capture plants to be capturing 12 Gt CO2 annually, with the total amount captured over the course of the solution just under 800 Gt of CO2. Using today’s air capture technology, with each air capture plant having the annual capacity to capture 279,000 tonnes of CO2, our solution would require a total of 43,011 air capture plants world wide (Keith). This number is an upper bound, however, since the 20 years before implementation of air capture will likely lead to improved efficiency and higher capture rates of air capture plants.
The following graph illustrates the amount of CO2 sequestered using each technology.
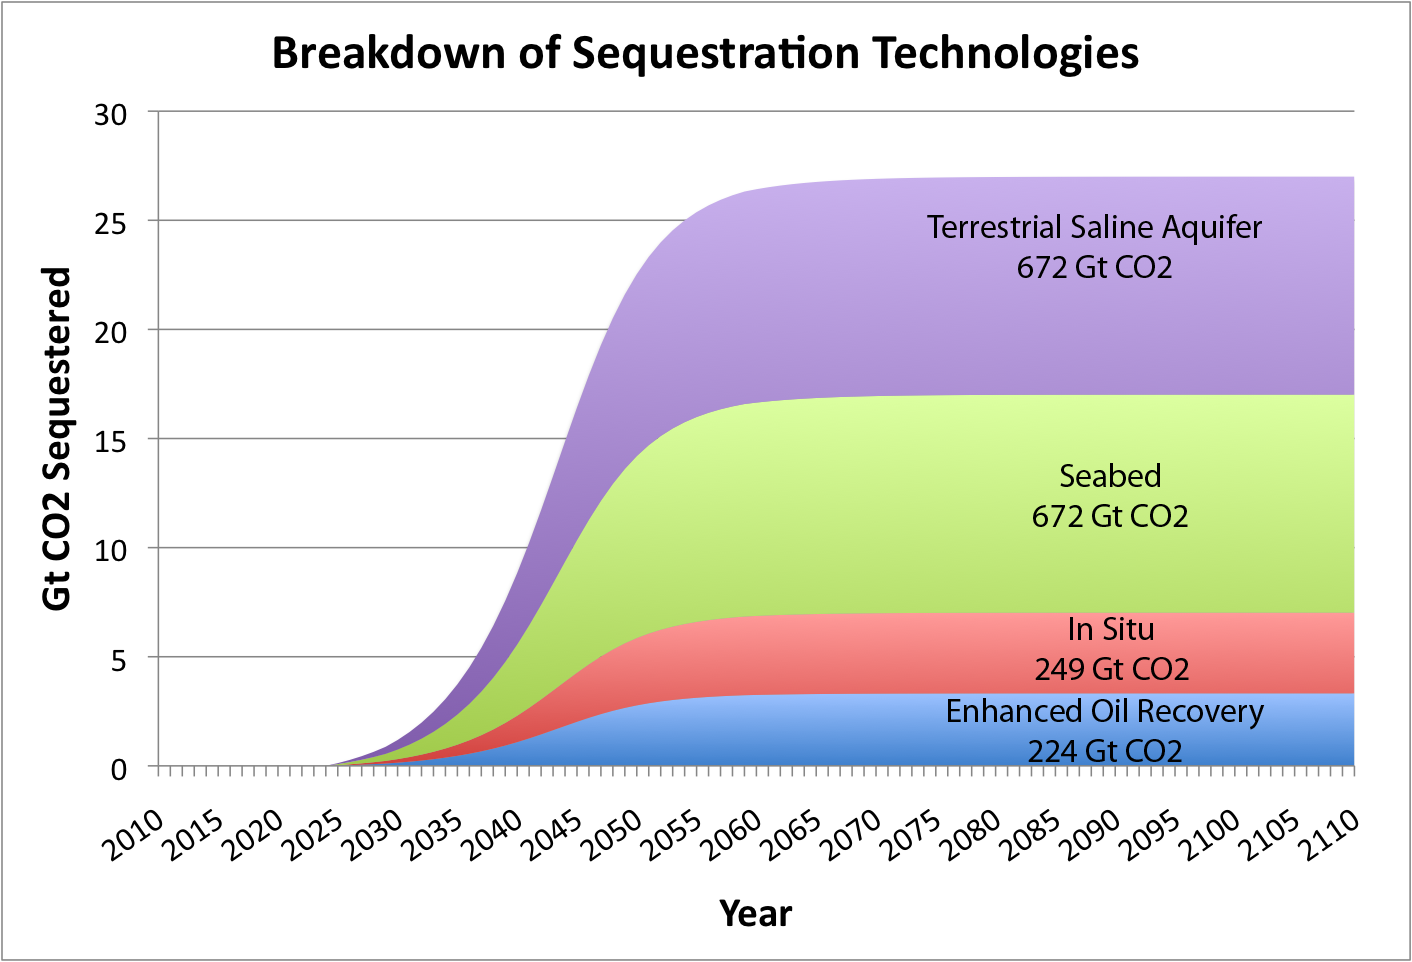
A total of 1817 Gt of CO2 will be sequestered over our 100 year plan. We divided the amount of CO2 being sequestered among seabed, terrestrial saline aquifer, in situ, and oil and gas reservoirs. Seabed sequestration and terrestrial saline aquifers each cover 37% of carbon being sequestered. Both technologies have the greatest capacities to store CO2. While seabed sequestration is more costly than terrestrial saline aquifers, many large cities with high emissions levels are close to the coast. This proximity to seabed sites makes the technology more viable by reducing the amount of transportation required. In situ sequestration and oil and gas reservoirs have smaller capacities, storing 13.7% and 12.3% of captured carbon respectively. Oil and gas reservoirs are used to a smaller extent since the technology continues our dependence on fossil fuels, which we are trying to wean ourselves away from. These distributions, however, are subject to change. As the plan progresses, these numbers should be reviewed and revised, as more information is gathered in regards to storage sites, costs of technologies, and capacities.
|
|
Terrestrial Saline Aquifer |
Seabed |
In Situ |
Oil and Gas Reservoirs |
|
Percent of CO2 Stored |
37% |
37% |
13.7% |
12.3% |
|
Total amount of CO2 Stored |
672 |
672 |
249 |
224 |
|
Maximum Annual of CO2 Stored |
10.0 |
10.0 |
3.70 |
3.32 |
References
Bhanoo, S. N. (2009, November 18). Seas grow less effective at absorbing carbon dioxide emissions. The New York Times, A13.
Dixon, R.K. (1995). Agroforestry system: sources or sinks of greenhouse gases?. Agrofor Syst, 31, 99-116
Houghton, R. A. (2003). The Contemporary Carbon Cycle. MA: Woods Hole Research Center.
Intergovernmental Panel on Climate Change Data Distribution Center. (September 2009). Carbon Dioxide: Projected Emissions and Concentrations. Retrieved from http://www.ipcc-data.org/ddc_co2.html on November 22 2009.
Keith, D.W., Ha-Duong M., Stolaroff, J. (January 2006) Climate Strategy with Co2 Capture from the Air. Earth and Environmental Science, Volume 74, Pages 17-45.
Kindermann G, et al. (2008) Global cost estimates of reducing carbon emissions
through avoided deforestation. Proc Natl Acad Sci USA 105:10302–10307.
Mahmoudkhani, M., Heidel, K.R., Ferreira, J.C., Keith, D.W., & Cherry, R.S. (2009). Low energy packed tower and caustic recovery for direct capture of CO2 from air. University of Calgary, Alberta, Canada: Energy and Environment System Group, Institute for Sustainable Energy Environment and Economy.