Case Study - United States
Background
The United States is one of the major contributors to climate change. A 2009 report from the BBC (based on research from the Potsdam Institute for Climate Impact Research and the World Bank) said that the U.S. was the second-greatest emitter of greenhouse gases in the world (6087 mt, or 15.5% of global greenhouse gas emissions) and has the fifth highest per-capita emission rate in the world (at 20 tons CO2 equivalent) (BBC, 2009). According to the International Energy Agency (IEA), its 2007 greenhouse gas emissions, at 5,769.3 million tonnes of carbon, were 20.2% of worldwide CO2 emissions. The IEA reports that these CO2 emissions increased 18.6% over 17 years, and the rate that these emissions increased at was 1.4% from 2006 to 2007 (IEA). And according to the McKinsey Report, based on its current trend of growth, the U.S. will be emitting 9.7 gigatons CO2e by 2030 (McKinsey & Company Conference Board, 2007).
The United States is taking domestic measures to be more environmentally green. Although responsible for a relatively large portion of greenhouse gas emissions, the United States is ahead of other countries in terms of some environmental legislation: it reduced the emissions of its primary air pollutants by 32% from 1970-1996 with the Air Quality Act and protects 84,000,000 acres of land through the National Park Service (EPA, 2009) (U.S. National Park Service). Much environmental legislation was put into action after the creation of the Environmental Protection Agency in 1970, but new legislation is often slow or difficult to pass in Congress because of conflicting interests with industries invested in fossil fuels. These policies and more promote a greater balance between industry and ecological preservation.
The United States has taken significant strides to progress environmental policy forward . For instance, the U.S. was heavily involved in the negotiations of the Kyoto Protocol, proposing such provisions as the Clean Development Mechanism, which allowed countries to count clean energy projects in developing countries as part of their emissions reductions. These negotiations came to a standstill because of domestic concerns on the transition from a fossil fuel economy to cleaner and more efficient energies and because the Protocol had no binding requirements for developing countries such as China to reduce emissions (Fletcher, 2003). Thus, the United States eventually signed but never ratified the Kyoto Protocol and left a large gap in international environmental policy.
Emissions Reduction
Figure 1: The Source of Cuts in Global Warming Emissions in 2030 (No Complementary Policies case vs. Reference case)
Click on figures for larger view.
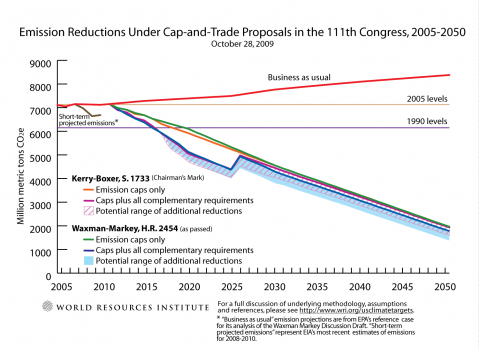
Figure 2: Emissions Reductions Under Cap-and-Trade Proposals in the 111th Congress, 2005-2050
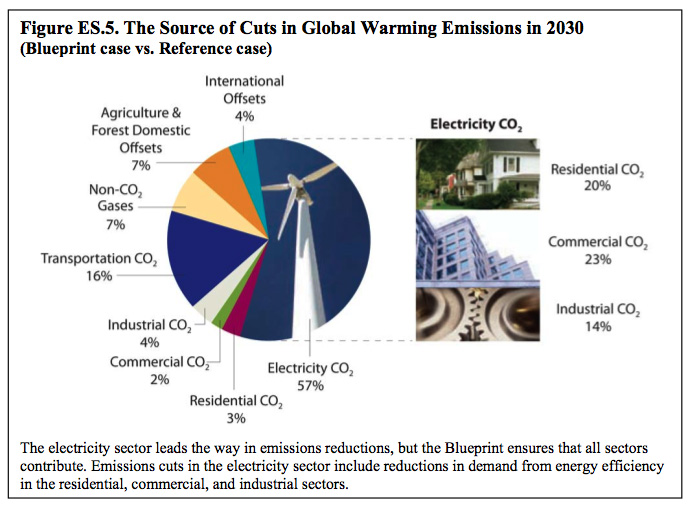
Figure 3: The Source of Cuts in Global Warming Emissions in 2030 (Blueprint case vs. Reference case)
Separate from international coordination, a climate bill, the Waxman-Markey Bill or "American Clean Energy and Security Act," that would reduce CO2e emissions by 4% below 1990 by 2020 before Copenhagen and create a cap-and-trade system in the U.S. is still being debated in the Senate as of November 20, 2009 that would set new targets for emissions reductions (BBC News, 2009) (The United States Congress House of Representatives, 2009). This bill includes a cap-and-trade plan that would apply to 67% of U.S. 2005 emissions in 2012 and 85% of U.S. 2005 emissions by 2016 in addition to the 2% of HFCs (a greenhouse gas), which means that 87% of 2005 emissions will be covered by cap-trade by 2016. The bill sets emissions reductions goals of 20% below 2005 levels by 2020, 42% by 2030, and 83% by 2050. The emissions caps are 17% by 2020, 42% by 2030, and 83% by 2050. In addition, part of the plan is to switch to 20% renewable energy by 2020 (Larsen, 2009). The basic cap-and-trade system sets a limit on the total number of emissions and then auctioning off emissions permits to industries while gradually lowering the cap. The idea is that companies that emit less than the cap can sell their permits to companies that emit more than the cap and thus have an economic incentive to pursue more energy efficient mechanisms. This system would allow for a smooth transition into a cleaner energy infrastructure. Additionally, the bill has several components such as investing in renewable energies, carbon capture and sequestration technologies, more efficient coal power plants, energy efficient standards, and an upgraded electricity grid. Furthermore, to guide the transition between a fossil fuel to clean energy economy, the Waxman-Markey Bill proposes using the revenue from auctioning off emissions permits to alleviate the transient rise in energy costs and job losses (Sheppard, 2009).
Although there are concerns on the United States' ability to make such a dramatic change in energy infrastructure, the Electric Power Research Institute (EPRI) estimates that the U.S. can reduce its emissions by 41% to 58% below 2005 levels by 2030 (Figure: usepri2030breakdown.tiff). (James, 2009) The Union of Concerned Scientist's report, "Climate 2030: A National Blueprint for a Clean Energy Economy," proposes a plan that would reduce emissions by 26% below 2005 levels by 2020 and 56% below 2005 levels by 2030 (Union of Concerned Scientists, 2009). Unlike the EPRI report, it does not factor in carbon capture and sequestration. Breakdowns of the emissions cuts from each plan are in Figure 1.
Sequestration Potential
According to the Congressional Budget Office, over the next fifty years the U.S. has the potential to sequester 40-60 billion metric tons of CO2 through biological sequestration and 1.2 trillion to 3.6 trillion metric tons through geological sequestration. Though there is a greater potential overall in geological sequestration, biological sequestration is more cost-effective now. It would only take a $5 price per metric ton of carbon to fund enough biological sequestration to use up half of its total potential and reduce U.S. emissions by 4% and $50 per metric ton of carbon dioxide for all of its potential to be used; currently CCS would need a $15-90 price per metric ton on carbon to be fully utilized (The United States Congressional Budget Office, 2007).
A list of current CCS sites in the U.S. and their capacities.
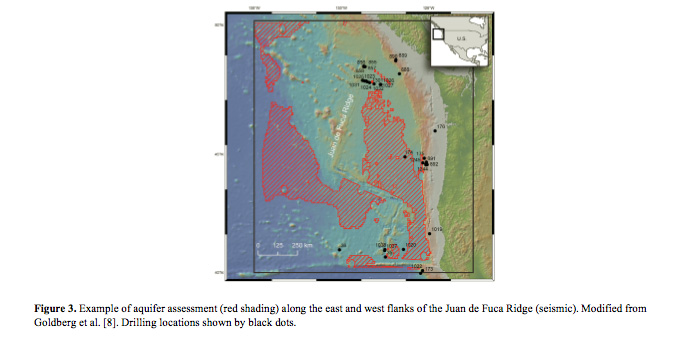
Deep Seabed Site in U.S. - Juan de Fuca Ridge, storage Potential: >200 Gt-C
Figure 4: Other figures to be included in relevant sections:
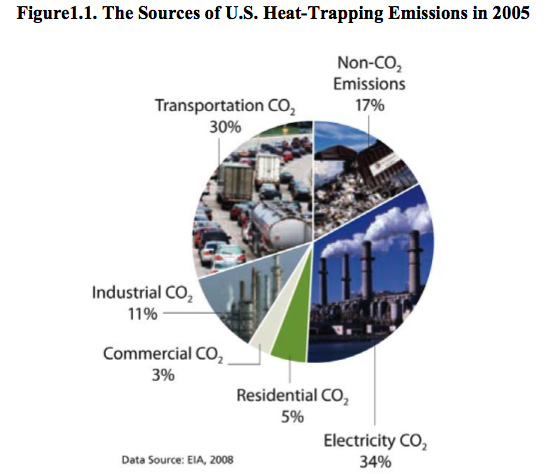
Figure 5: The Sources of US Heat-Trapping Emissions in 2005

Figure 6: 2009 Prism Analysis of Potential of US Electricity Sector to Reduce Emissions by 2030
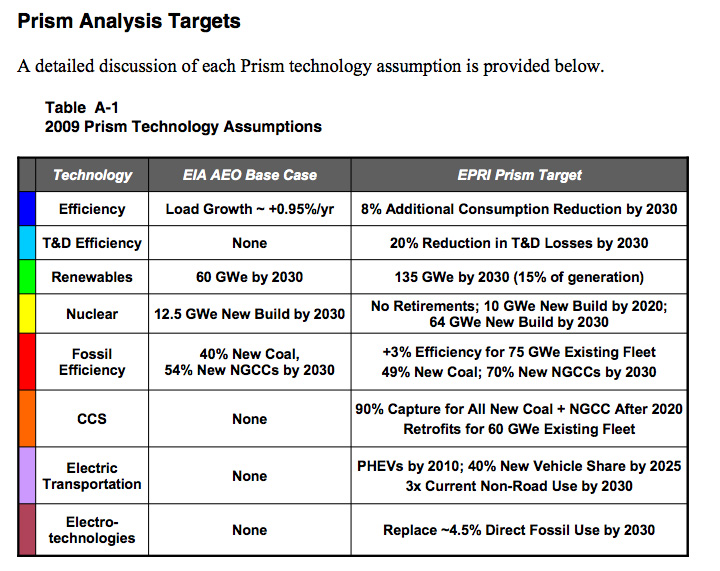
Figure 7: 2009 Prism Technology Assumptions
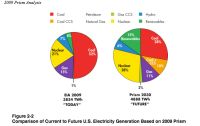
Figure 8: Comparison of Current to Future US Electricity Generation Based on 2009 Prism


